Tracking business financial KPIs is the most direct way for business owners and managers to measure financial health and make decisions grounded in data rather than instinct. Key performance indicators (KPIs) are quantifiable metrics that reveal whether a business is profitable, liquid, and growing at a sustainable rate. Regular KPI review correlates with higher five-year business survival rates. Metrics like net profit margin, debtor days (DSO), and debt-to-equity ratio give you a clear picture of where the business stands and where it needs to go. Without them, you are managing by feel, and that is a risk no growth-focused business can afford.
Why track business financial KPIs: the core case
Financial KPIs convert vague impressions into measurable facts. A business owner who knows their gross profit margin is 38% and their DSO is 52 days has two concrete problems to address. One who only knows “sales feel slow” has nothing to act on. Net profit margin targets of 10–20% and debtor days under 45 are widely used benchmarks for evaluating business stability. These numbers tell you exactly how far you are from where you need to be.
The importance of financial KPIs extends beyond internal management. Lenders evaluate your creditworthiness using the same metrics. Businesses showing organized KPI data secure more favorable financing terms than those that cannot demonstrate command of their numbers. A debt-to-equity ratio below 1.5 signals financial discipline to any bank or venture capital firm reviewing your file. That discipline starts with consistent tracking.

KPIs also create a shared language across your organization. When your sales team knows that DSO is rising, they understand why collections matter. When your operations team sees burn rate climbing, they connect spending decisions to runway. That shared context drives faster, better decisions at every level of the business.
What are the core financial KPIs every business should track?
Every business needs a focused set of metrics that covers profitability, liquidity, leverage, and growth. The right KPIs depend on your business model and stage, but the following categories apply to nearly every company.
Profitability metrics
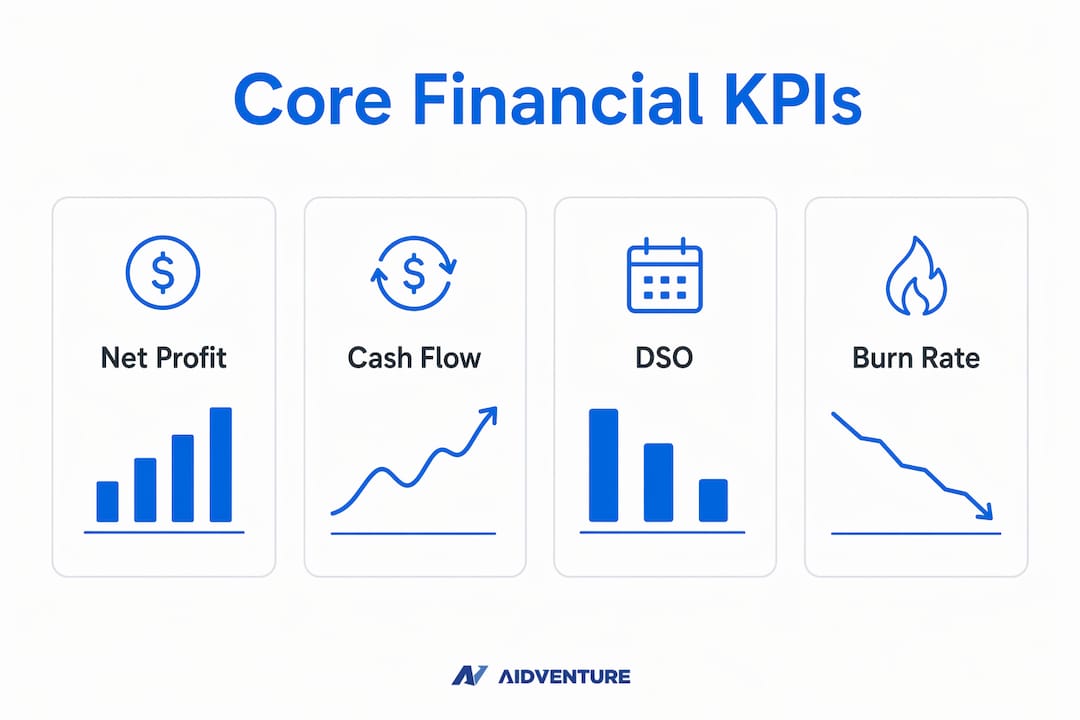
- Net profit margin: Net income divided by revenue, expressed as a percentage. A target of 10–20% is a common benchmark for stable businesses.
- Gross profit margin: Revenue minus cost of goods sold, divided by revenue. This reveals how efficiently you produce or deliver your product before overhead.
- Operating cash flow: Cash generated from core business operations. Positive operating cash flow means the business funds itself without relying on debt or outside investment.
Liquidity and leverage metrics
- Current ratio: Current assets divided by current liabilities. A ratio above 1.0 means you can cover short-term obligations. Below 1.0 signals a potential cash crunch.
- Debtor days (DSO): The average number of days it takes to collect payment after a sale. Keeping DSO under 45 days protects cash flow and reduces bad debt risk.
- Debt-to-equity ratio: Total debt divided by shareholder equity. A ratio below 1.5 is generally viewed as healthy by lenders.
- Burn rate: For startups and growth-stage companies, burn rate measures how quickly you spend cash reserves. A burn multiple under 2x is a common efficiency target.
Growth metrics
- Revenue growth rate: The percentage increase in revenue over a defined period. Consistent growth above your industry average signals strong market position.
- Annual Recurring Revenue (ARR): Particularly critical for SaaS businesses, ARR shows predictable, contracted revenue on an annualized basis.
Pro Tip: Focusing on 10–15 core KPIs reviewed consistently produces more insight than tracking dozens of metrics sporadically. Start with the metrics most directly tied to your current business priorities.
| KPI | What it measures | Common target |
|---|---|---|
| Net profit margin | Overall profitability after all costs | 10–20% |
| DSO (debtor days) | Speed of cash collection | Under 45 days |
| Current ratio | Short-term liquidity | Above 1.0 |
| Debt-to-equity ratio | Financial leverage | Below 1.5 |
| Burn rate | Cash efficiency for growth-stage firms | Under 2x burn multiple |
Why does tracking financial KPIs boost decision-making and growth?
KPIs function as an early-warning system for your business. Weekly tracking of efficiency metrics allows teams to catch problems before they compound into quarterly losses. A sudden drop in gross margin, for example, can signal a supplier price increase or a pricing error that needs correction within days, not months. Waiting for the annual review means the damage is already done.
The distinction between leading and lagging indicators matters enormously here. Lagging indicators like net profit report what already happened. Leading indicators predict what is coming. Tracking discovery calls indicates future sales and revenue approximately 30 days in advance. Building both types into your KPI set gives you a rearview mirror and a windshield at the same time.
“A KPI must influence a decision when it changes to be effective. Metrics that merely describe past performance dilute management focus and slow response time.”
Decision-linked KPIs have clear action plans tied to specific thresholds. If DSO crosses 50 days, the accounts receivable team escalates collections. If gross margin drops below 35%, pricing or procurement gets reviewed. That cause-and-effect structure turns a number on a dashboard into a management tool.
Pro Tip: Assign a named owner to each KPI. The person responsible for DSO should be the same person who answers for it in every review meeting. Ownership creates accountability, and accountability drives results.
Companies growing predictably use approximately 8–12 KPIs reviewed weekly to stay focused. That discipline separates businesses that react to crises from those that prevent them.
How to implement an effective financial KPI tracking system
A KPI system only works if it is built to drive action, not just produce reports. These steps create a framework that actually influences decisions.
-
Select your KPI set. Choose 8–15 metrics that cover profitability, liquidity, leverage, and growth. Align each one with a current business priority. A startup focused on scaling should weight ARR and burn rate heavily. A mature business should weight net profit margin and operating cash flow.
-
Assign clear ownership. Every KPI needs one named owner responsible for data accuracy and for explaining changes in review meetings. Shared ownership means no ownership.
-
Set thresholds. Define red, yellow, and green zones for each metric. Green means on track. Yellow means watch closely. Red means act immediately. Thresholds remove ambiguity and speed up response time.
-
Establish review cadence. Monthly review is the minimum standard for profitability and ratio metrics. Cash flow and receivables benefit from weekly monitoring. Match the review frequency to how quickly the metric can change and how quickly you need to respond.
-
Integrate scenario planning. Leading financial KPIs paired with scenario analyses model the impact of changes on cash flow, profitability, and growth. This turns KPI data into forward-looking strategy, not just backward-looking reporting.
-
Review and evolve the framework annually. An effective KPI framework shifts focus as a business matures. Early-stage companies prioritize runway and growth rate. Mature companies shift toward profit margins and operating efficiency. A KPI set that made sense at $500,000 in revenue may be the wrong set at $5 million.
Pro Tip: Build a financial KPI dashboard with two tiers: a small executive set of 5–6 headline metrics reviewed weekly, and a deeper functional set reviewed monthly by department heads. This balances breadth with focus.
| Review frequency | Metrics best suited |
|---|---|
| Weekly | Cash flow, DSO, burn rate, sales pipeline |
| Monthly | Gross margin, net profit margin, current ratio |
| Quarterly | Debt-to-equity, ARR growth, revenue growth rate |
| Annually | Full KPI framework review and realignment |
Common pitfalls to avoid when tracking financial KPIs
Most KPI programs fail not because of bad data but because of bad habits. These are the mistakes that consistently undermine financial KPI tracking.
- Tracking too many metrics. A dashboard with 40 KPIs produces noise, not insight. When everything is a priority, nothing is. Limit your core set to 8–15 metrics and review them consistently.
- Using KPIs only for reporting. KPIs presented in a board deck and never discussed again serve no purpose. KPIs are leadership tools that align teams and create accountability, not just reporting metrics.
- Ignoring leading indicators. Businesses that track only lagging metrics like net profit are always looking backward. Add at least two or three leading indicators to your set so you can see problems forming before they hit the income statement.
- Inconsistent review cadence. Reviewing KPIs quarterly when cash flow changes weekly means you are always behind. Match review frequency to the speed of each metric.
- Failing to align KPIs with strategy. A KPI that does not connect to a current business goal wastes attention. Every metric on your dashboard should answer the question: “If this number improves, does the business move forward?”
Pro Tip: When a department is underperforming, build a short-term focused dashboard tracking that team’s process metrics weekly for six weeks. This pinpoints bottlenecks faster than any broad report.
Key Takeaways
Tracking business financial KPIs transforms raw numbers into decisions, and consistent measurement of a focused metric set is the single most reliable path to sustained financial control and growth.
| Point | Details |
|---|---|
| Start with a focused set | Track 8–15 core KPIs covering profitability, liquidity, leverage, and growth. |
| Assign metric ownership | Name one person responsible for each KPI to drive accountability and accuracy. |
| Match cadence to speed | Review cash flow weekly and profitability metrics monthly for timely intervention. |
| Include leading indicators | Add predictive metrics like discovery calls or pipeline value alongside lagging ones. |
| Evolve the framework | Review your full KPI set annually and shift focus as the business matures. |
The discipline that separates good businesses from great ones
I have worked with enough business owners to know that the KPI conversation almost always starts the same way. They have a spreadsheet, a gut feeling, and a vague sense that something is off. What they rarely have is a disciplined, consistent system that tells them exactly where to look and what to do next.
The biggest misunderstanding I see is treating KPIs as a reporting obligation rather than a management tool. A metric that does not change your behavior when it moves is not a KPI. It is a statistic. The businesses I have seen grow fastest are the ones that use their KPI data the way a doctor uses diagnostic tests: to identify the problem, isolate the cause, and prescribe a specific fix.
The second thing I would push back on is the idea that you need a sophisticated system before you can start. You do not. A focused set of five or six metrics reviewed every week in a 30-minute meeting produces more value than an elaborate dashboard nobody looks at. Start simple. Build the habit. Then add sophistication as the business grows and the questions get more complex.
The shift from growth metrics to profitability metrics as a company matures is also something most founders underestimate. What got you to $1 million in ARR is not what gets you to $10 million in profit. Your KPI set needs to evolve with you, and that requires an annual honest look at whether you are measuring the right things. That discipline, more than any single metric, is what separates good businesses from great ones.
— Sergio
How Aidventure helps you build a KPI system that works
Knowing which KPIs to track is one thing. Building a system that produces reliable data, assigns clear ownership, and connects metrics to decisions is another challenge entirely.

Aidventure works with SaaS startups and growth-stage businesses to design and manage exactly that kind of system. Through fractional CFO services, Aidventure implements KPI frameworks tailored to your business stage, whether you are focused on burn rate and ARR or shifting toward profitability and operating cash flow. For businesses that need financial clarity without a full-time finance team, managing finances without a full-time CFO is exactly what Aidventure is built for. The result is a reporting structure that drives decisions, not just documents them.
FAQ
What are financial KPIs?
Financial KPIs are quantifiable metrics used to measure a business’s financial performance against defined targets. Common examples include net profit margin, DSO, current ratio, and revenue growth rate.
How many KPIs should a business track?
Tracking 8–15 core KPIs consistently produces better decisions than monitoring dozens of metrics sporadically. Focus on metrics that directly connect to your current business priorities.
How often should financial KPIs be reviewed?
Monthly review is the minimum standard for profitability and ratio metrics. Cash flow and receivables benefit from weekly monitoring to catch problems before they escalate.
Why do lenders care about financial KPIs?
Lenders use KPIs like debt-to-equity ratio and DSO to assess creditworthiness. Businesses that demonstrate organized KPI tracking secure more favorable loan terms and financing conditions.
What is the difference between leading and lagging KPIs?
Lagging KPIs report past results, such as net profit. Leading KPIs predict future outcomes, such as sales pipeline volume or discovery call volume. Effective KPI sets include both types.