Pipeline coverage ratio is your total qualified pipeline value divided by your revenue quota for the same period, and the real target isn’t a generic multiple. It’s 1 divided by your historical win rate. A team closing 25% of qualified deals needs roughly 4x coverage; a team closing 33% needs closer to 3x. If your current coverage sits below that number, you have two levers this week: generate more qualified pipeline or fix whatever is dragging down your win rate.
- Formula: Total qualified pipeline ÷ revenue quota = pipeline coverage ratio
- Target rule: Required coverage = 1 ÷ historical win rate
- Rule of thumb: 3x to 5x depending on segment and win rate, reviewed weekly by RevOps
- If below target: Escalate pipeline generation or run a forecast hygiene pass before the quarter closes
At Aidventure, this calculation shows up constantly during SaaS KPI audits, usually because a founder trusted a flat “3x rule” that never matched their actual close rates.
Key Takeaways
Pipeline coverage ratio only works as a forecasting tool when it’s calculated from your actual historical win rate, not a borrowed industry multiple.
| Point | Details |
|---|---|
| Use the right formula | Required coverage equals 1 divided by your historical win rate, not a flat 3x rule. |
| Segment before you benchmark | SMB, mid-market, enterprise, and mega-deals each need a different coverage target. |
| Separate raw from weighted | Raw coverage shows volume; weighted coverage shows what’s likely to actually close. |
| Audit CRM hygiene monthly | Stale deals, bad close dates, and blended win rates all inflate coverage falsely. |
| Get a KPI audit | Aidventure’s SaaS KPI audit builds a coverage target from your own data and CRM history. |
Table of Contents
- What Pipeline Coverage Ratio Measures and How to Calculate It
- What Counts as Good Pipeline Coverage by Segment
- Mistakes That Make Your Coverage Number a Lie
- How to Track Coverage Accurately in Your CRM
- Turning Coverage Into a Forecast You Can Act On
- Why Coverage Is One of the First Numbers I Check
- How Aidventure Helps SaaS Teams Fix a Coverage Problem
- Sources
What Pipeline Coverage Ratio Measures and How to Calculate It
Pipeline coverage ratio answers one question: do you have enough in-flight opportunity to hit your number? There are two ways to calculate it, and mixing them up is the fastest way to misread your own forecast.
Raw coverage sums the dollar value of every qualified, open opportunity in your CRM and divides it by quota. It treats a deal in early discovery the same as one with a signed order form pending signature, which makes it a blunt early-quarter gauge.
Weighted coverage multiplies each deal’s value by its stage probability before summing, based on historical stage-to-close conversion rates. A $50,000 deal sitting at a stage that historically closes 20% of the time contributes $10,000 to weighted pipeline, not $50,000. This is why weighted coverage becomes more useful as the quarter progresses. Early on, raw coverage tells you whether you even have enough at bat; by mid-quarter, weighted coverage tells you what’s actually likely to land.
To calculate either figure, work through this checklist:
- Define the exact period (fiscal quarter, not a rolling 90 days)
- Filter for deals that meet your qualification bar, not raw leads or MQLs
- Confirm every included deal has a close date inside that period
- Sum the qualified value, then divide by the quota for that same period
Here’s the math side by side:
Pull these numbers straight from a CRM export filtered by stage and close-date rules, and you’ll catch discrepancies between raw and weighted views before they surprise you at forecast call.
What Counts as Good Pipeline Coverage by Segment
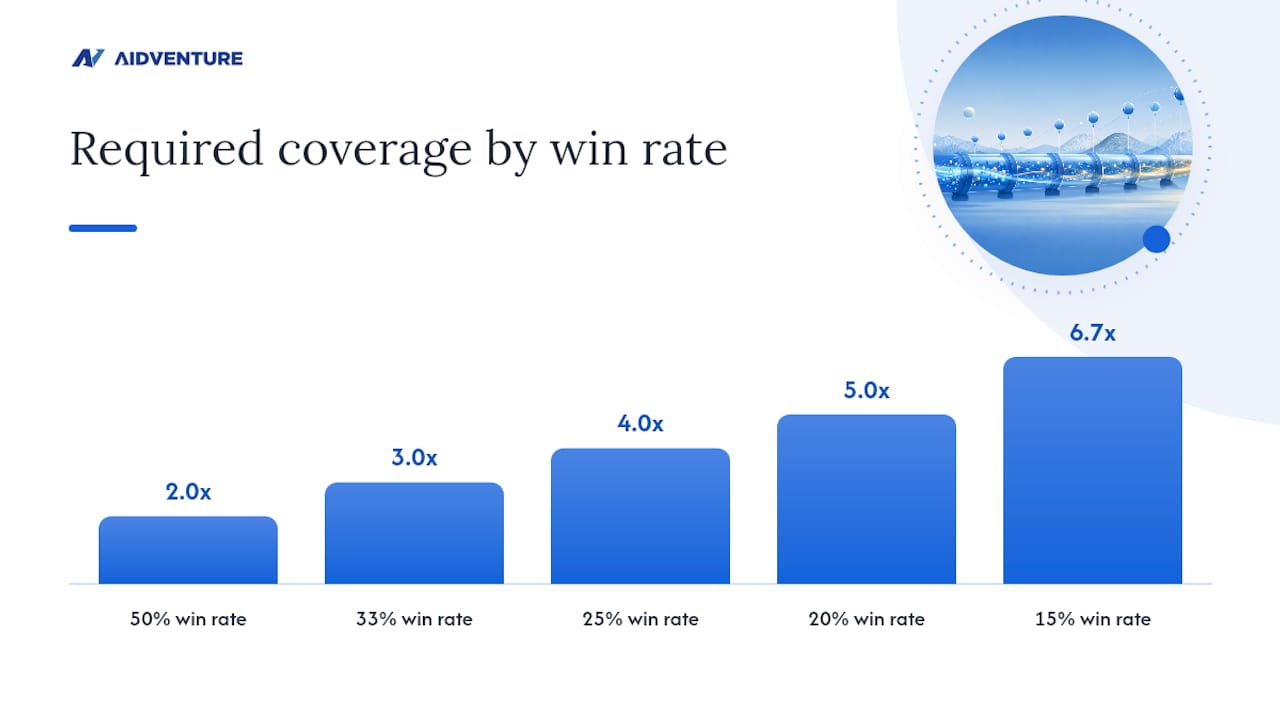
There’s no single healthy number, because required coverage depends entirely on how often you win and how long deals take to close. The starting formula is simple: required coverage = 1 ÷ historical win rate.
Run that formula across common SaaS win rates and the multiples diverge fast:
- 50% win rate → 2.0x coverage required
- 33% win rate → 3.0x coverage required
- 25% win rate → 4.0x coverage required
- 20% win rate → 5.0x coverage required
- 15% win rate → 6.7x coverage required
The commonly cited “3x rule” assumes a 33% win rate, a figure that held up better a few years ago than it does now. Many enterprise SaaS teams see win rates closer to 20%, which pushes the real required multiple toward 4x to 5x rather than the textbook 3x.
Segment matters as much as win rate:
- SMB/transactional: Shorter cycles, higher win rates, often 2.5x to 3.5x is sufficient
- Mid-market: Longer evaluation, more stakeholders, typically 3.5x to 4.5x
- Enterprise: Multi-stakeholder procurement and lower win rates push this to 4.5x to 6x
- Strategic/mega-deals: Small sample sizes and long cycles often require 6x or more, tracked individually rather than blended into a ratio
New territories and ramping reps need padding on top of the formula, not instead of it. The better long-term fix is segmenting targets by motion, region, and product line instead of publishing one company-wide coverage number that flatters your best segment and hides risk in your worst one.
Mistakes That Make Your Coverage Number a Lie
A coverage ratio can look healthy and still be wrong. The most common culprit is period misalignment: including deals with close dates outside the quota period inflates the ratio without adding anything that can actually close in time.
Other frequent distortions:
- Unqualified pipeline counted as qualified. MQLs and early discovery calls padding the number without meeting your qualification gate.
- Stale or duplicate deals. Opportunities untouched for 60+ days that nobody has closed out, still counted at full value.
- Optimistic close dates. Reps pushing dates forward to stay inside the current period rather than reflecting real buyer timelines.
- Blended win rates across motions. Averaging a 45% SMB win rate with a 15% enterprise win rate produces a required-coverage number that fits neither segment.
Each of these has a specific fix: tighten the CRM qualification filter, run a stale-deal report and force reps to close or requalify, audit close-date changes for patterns, and calculate win rate separately per segment rather than company-wide.
There’s also a structural distinction worth keeping straight: raw pipeline coverage measures total qualified value against quota, while forecast coverage applies stage probabilities to estimate what’s actually likely to close. A team can show 4x raw coverage and still miss quota if that pipeline sits concentrated in early stages with low historical conversion.
Pro Tip: Run a “coverage age” report monthly, sorting open opportunities by days in current stage. Anything sitting twice as long as your average stage duration is either about to close or already dead. Treat it as dead until proven otherwise.
How to Track Coverage Accurately in Your CRM
Coverage is only a useful leading indicator if the underlying data is clean. That starts with CRM configuration, not a dashboard.
Set up these filters before you trust any coverage number:
- Qualification gate criteria — define exactly what “qualified” means (budget confirmed, champion identified, timeline set) and enforce it as a required field, not a judgment call.
- Valid close-date rules — exclude any opportunity whose close date falls outside the reporting period, no exceptions.
- Duplicate and stale-deal exclusion — filter out opportunities untouched for a defined threshold (30 to 60 days depending on cycle length).
- Stage definitions mapped to historical conversion — each stage should have a documented, backward-tested probability, not an arbitrary percentage assigned once and never revisited.
Once the filters are right, report these metrics weekly:
- Raw coverage ratio
- Weighted (probability-adjusted) coverage
- Late-stage coverage specifically
- Pipeline velocity (average days in stage)
- Win rate by segment
- Activity-adjusted coverage (deals with recent engagement vs. dormant ones)
To calculate a real stage probability, pull the last four quarters of closed-won and closed-lost deals by stage, and divide the number that progressed from each stage to closed-won by the total that ever entered that stage. That number, not a guess, becomes your weighting.
On cadence: weekly rep and manager reviews catch erosion early, monthly segment deep-dives catch systemic issues one rep can’t see, and quarterly target resets keep your required-coverage math current as win rates shift.
Turning Coverage Into a Forecast You Can Act On
Coverage only matters if it changes a decision. The conversion step is straightforward: expected closed value = raw pipeline × historical win rate, or, more precisely, the sum of your weighted pipeline. Divide that expected value by quota, and you get your expected output as a multiple of target.
- Escalate pipeline generation — targeted outbound, partner referrals, or expansion pulled forward from existing accounts.
- Run a forecast hygiene pass — the pitfalls above (stale deals, bad close dates, blended win rates) often account for more of the gap than an actual generation shortfall.
- Adjust the plan or flag executives — if hygiene and generation both come up short, surface the risk early rather than at quarter-end.
Mid-quarter, shift weight toward late-stage coverage specifically. Early-stage volume matters less at that point because it can’t convert in time.
Coverage is trustworthy when the period is aligned, qualification is consistently applied, and win rates are stable enough to trust. It becomes noise fast in a new segment, with a ramping rep, or in a CRM nobody has cleaned in two quarters.
Know which condition you’re in before you let a coverage number drive a real decision.
Why Coverage Is One of the First Numbers I Check
Pipeline coverage is one of the earliest signals of revenue risk, well ahead of a missed quota showing up on a P&L. A thinning coverage ratio three or four weeks into a quarter tells you a cash and hiring conversation is coming before the revenue line confirms it.
The tension worth watching is between generating more pipeline and protecting margin. Chasing volume with unqualified leads burns marketing spend without moving the win-rate needle, and it’s a mistake I see founders make when they misread a low coverage number as purely a top-of-funnel problem.
Pro Tip: Track coverage trend, not just coverage level, as an early-warning input to your cash flow forecasting. A ratio declining two quarters running is often the first sign a hiring plan needs to slow down before revenue confirms it.

How Aidventure Helps SaaS Teams Fix a Coverage Problem
Most SaaS founders discover their coverage number is wrong the same way: mid-quarter, when the forecast stops matching reality. Aidventure’s SaaS KPI audit exists to catch that earlier, walking through win rate by segment, stage conversion history, and CRM hygiene before a bad number becomes a bad quarter.

Clients typically come out of the audit with a segmented coverage target instead of a single company-wide guess, plus a clear read on whether the fix is pipeline generation, win-rate coaching, or CRM discipline. For teams without a full-time finance function to run this analysis internally, Aidventure’s fractional CFO services build coverage tracking directly into monthly forecasting and board reporting, so the number holds up under investor scrutiny. If your last forecast call raised more questions than it answered, book a KPI audit and get a coverage target built from your own win rate, not a borrowed rule of thumb.
Sources
- Pipeline Coverage Ratio: Targets and How to Improve
- Pipeline Coverage Ratio: How Much Pipeline Do You Need?
- What is Pipeline Coverage: Why 3x Isn’t the Answer and How to Build the Number That Is | Lative