The RevOps metrics that matter most for a SaaS company are pipeline velocity, pipeline coverage, forecast accuracy, win rate, MQL→SQL conversion, lead response time, net revenue retention (NRR), and CAC payback. Assign each one an owner and a cadence before you build a single dashboard. Track these eight, review them on a fixed schedule, and most of the “we don’t have visibility” complaints inside a revenue org disappear within a quarter.
Your executive dashboard should never carry more than these four at the top:
- Pipeline coverage ratio
- Forecast accuracy
- Net revenue retention
- CAC payback period
Pro Tip: Assign a single RevOps or finance owner to the weekly working dashboard and a monthly executive pack review with sales, marketing, and CS leadership. Start this week, not next quarter.
Key Takeaways
Full-funnel RevOps metrics only work when each one has a named owner, a defined source, and a fixed review cadence tied to a real decision.
| Point | Details |
|---|---|
| Prioritize eight core metrics | Track pipeline velocity, coverage, forecast accuracy, win rate, MQL→SQL, response time, NRR, and CAC payback first. |
| Split dashboards by purpose | Use a 5 to 7 metric weekly working dashboard and a 8 to 12 metric monthly executive pack. |
| Map every metric to an action | Define the first diagnostic step and owner before a metric moves, not after. |
| Govern definitions like code | Keep a metric dictionary with a change log and require sign-off before formulas change. |
| Get outside help when definitions drift | Aidventure’s SaaS KPI audit and fractional CFO services clean up metric definitions and build the dashboards for you. |
Table of Contents
- What Are RevOps Metrics, and Why Do SaaS Teams Need Them?
- The Core RevOps Metric Categories You Need to Know
- Canonical Full-Funnel Metrics: Formulas, Owners, and Cadence
- How to Operationalize These Metrics So They Actually Get Used
- What to Do When a Metric Moves
- Best Practices and Pitfalls That Sink RevOps Programs
- Building Metric Governance That Scales
- What a Working Dashboard and Executive Pack Should Look Like
- Your 30/60/90 Day Checklist for Rolling This Out
- What Experienced RevOps Leaders Actually Prioritize
- How Aidventure Helps You Turn RevOps Metrics Into Decisions
- Sources
What Are RevOps Metrics, and Why Do SaaS Teams Need Them?
RevOps metrics are the operational KPIs that connect marketing, sales, customer success, and finance into one shared view of how revenue actually moves through the business. They exist to end an argument, not start one. When a VP of Sales says pipeline is “fine” and a VP of Marketing says lead quality is “fine,” a RevOps metric like MQL→SQL conversion settles the disagreement with a number both sides trust.
A good RevOps metric passes three tests:
- Diagnostic power. It points to a specific cause, not just a symptom.
- Clear ownership. One person or team is accountable for moving it.
- A defined source and cadence. It comes from a named system (CRM, billing platform, marketing automation) and gets reviewed on a set schedule, not whenever someone remembers.
Take MQL→SQL conversion as an example. But it tells you exactly where to look: either lead scoring criteria have drifted, the source mix has shifted toward lower-intent channels, or sales reps are rejecting leads faster than usual. That single full-funnel KPI turns a vague complaint about “bad leads” into a specific handoff investigation between marketing and sales.
The Core RevOps Metric Categories You Need to Know
Every full-funnel RevOps program organizes around a small set of categories, and knowing which bucket a metric belongs to tells you what question it’s answering and who should own the follow-up.
- Demand quality asks whether the leads entering the funnel are worth pursuing. Metrics here include lead source mix and MQL conversion rate.
- Conversion measures how efficiently prospects move between stages, from visitor to lead to opportunity to closed deal.
- Velocity answers how fast revenue moves through the pipeline, combining deal count, deal size, win rate, and cycle length into a single throughput number.
- Pipeline quality looks at whether the pipeline you’re reporting is real. Stale, undated, or duplicate opportunities inflate this category’s numbers fast.
- Forecast quality measures how close your predicted revenue lands to what actually closes.
- Revenue efficiency covers CAC, CAC payback, and LTV:CAC, tying spend directly to return.
- Retention and expansion tracks NRR, GRR, and churn, the metrics that determine whether growth compounds or leaks out the back door.
- Data quality is the meta-category. It measures whether your CRM fields, close dates, and stage definitions are trustworthy enough for the other seven categories to mean anything.
Grouping metrics this way also helps you organize by outcome: efficiency, effectiveness, and predictability. A five-person seed-stage team leans hard on demand quality and conversion because they’re still proving product-market fit. A Series C company with 200 reps leans on forecast quality and retention because predictability is what keeps the board calm.
Canonical Full-Funnel Metrics: Formulas, Owners, and Cadence
This is the reference table. Every metric below includes its formula, who owns it, how often it should be reviewed, where the data comes from, and the one caveat that trips teams up most often.
| Metric | Formula | Owner | Cadence | Data Source | Caveat |
|---|---|---|---|---|---|
| Visitor→Lead rate | Leads ÷ Site visitors | Marketing | Weekly | Marketing automation | Segment by channel; paid and organic behave differently |
| Lead→MQL rate | MQLs ÷ Total leads | Marketing | Weekly | Marketing automation | Scoring model drift skews this silently |
| MQL→SQL rate | SQLs ÷ MQLs | Marketing + Sales | Weekly | CRM | Exclude leads sales never actually worked |
| SQL→Opportunity rate | Opportunities ÷ SQLs | Sales | Weekly | CRM | Watch for reps creating opportunities too early |
| Win rate | Closed-won ÷ (Closed-won + closed-lost) | Sales | Monthly | CRM | Exclude stale or “zombie” deals from the denominator |
| Sales cycle length | Days from opportunity creation to close | RevOps | Monthly | CRM | Segment by deal size; enterprise cycles skew averages |
| Pipeline velocity | (Opportunities × Win rate × Deal size) ÷ Cycle length | RevOps | Weekly | CRM | Track inputs separately, not just the composite score |
| Pipeline coverage ratio | Open pipeline ÷ Quota | Sales + RevOps | Weekly | CRM | Healthy range runs roughly 3 to 5 times quota for early-stage pipeline |
| Forecast accuracy | 1 minus ( | Forecast minus Actual | ÷ Forecast) | RevOps + Finance | Monthly |
| ARR / MRR | Sum of active recurring revenue | Finance | Monthly | Billing system | Separate new, expansion, and reactivated revenue |
| CAC | Total sales + marketing cost ÷ New customers | Finance | Monthly | Finance + CRM | Fully loaded CAC includes salaries, not just ad spend |
| CAC payback period | CAC ÷ (ARPA × Gross margin) | Finance | Quarterly | Finance | Benchmark 12 to 18 months depending on segment |
| LTV:CAC | Customer lifetime value ÷ CAC | Finance | Quarterly | Finance + Billing | Target ratio of roughly 3:1 for sustainability |
| NRR | (Starting ARR + expansion minus churn minus contraction) ÷ Starting ARR | Customer Success | Monthly | Billing system | Healthy growth-stage B2B SaaS companies usually run a net revenue retention around 100% or higher |
| GRR | (Starting ARR minus churn minus contraction) ÷ Starting ARR | Customer Success | Monthly | Billing system | GRR excludes expansion; never substitute one for the other |
| Churn rate | Customers lost ÷ Total customers at period start | Customer Success | Monthly | Billing system | Report logo churn and revenue churn separately |
| CRM completeness | Records with required fields filled ÷ Total records | RevOps | Monthly | CRM | Track by object type: contacts, opportunities, accounts |
| Handoff completeness | Handoffs meeting SLA criteria ÷ Total handoffs | RevOps | Monthly | CRM | Define SLA criteria before measuring, not after |
Speed matters more than most teams assume. Research on online sales leads found response time is one of the strongest predictors of whether a lead ever converts, which is why lead response time deserves a weekly SLA check even though it isn’t in the table above as a standalone formula. Track it as a qualifier on your MQL→SQL rate, not a separate silo.
How to Operationalize These Metrics So They Actually Get Used
A metric definition sitting in a slide deck does nothing. Operationalizing it means writing down five things for every metric: the canonical definition, the owner, the source field, the transformation rule, and the acceptance criteria that trigger a review.
Skip any one of those five and the metric will drift. A common failure: two teams both report “pipeline coverage,” but one excludes deals without a close date and the other doesn’t. Six months later nobody trusts either number.
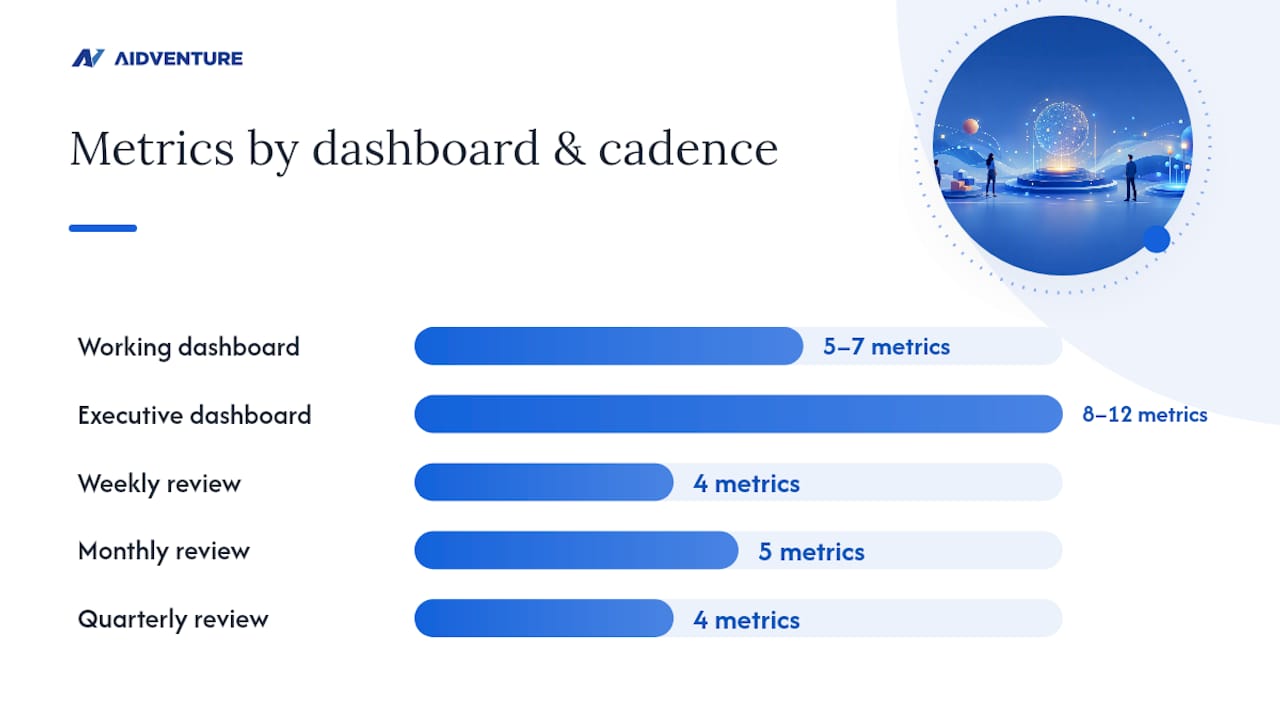
Split your dashboards into two tiers. A working dashboard carries 5 to 7 metrics, reviewed weekly by RevOps, sales management, and marketing ops. It’s built for diagnosis: velocity inputs, coverage ratio, lead response time, MQL→SQL rate. An executive dashboard carries 8 to 12 metrics, reviewed monthly or quarterly, aimed at strategy rather than troubleshooting. That’s where NRR, forecast accuracy, CAC payback, and ARR growth belong. This split matches what most mature RevOps frameworks recommend, and it keeps the executive view from becoming noise.
| Cadence | What gets reviewed | Who attends |
|---|---|---|
| Weekly | Pipeline coverage, velocity inputs, MQL→SQL, lead response time | RevOps, sales managers, marketing ops |
| Monthly | Forecast accuracy, win rate, NRR, churn, CAC | RevOps, Finance, CS leadership, sales VP |
| Quarterly | ARR growth, LTV:CAC, CAC payback, governance audit | Founders, Finance, department heads |
If your team is still tracking metrics in spreadsheets pulled manually from three systems, that’s usually the first thing to fix. Aidventure’s SaaS KPI audit exists specifically to catch these definition mismatches before they cost a board meeting.
What to Do When a Metric Moves
A metric without a mapped response is a chart nobody acts on. The table below gives the first diagnostic step for the moves that happen most often.
| Metric change | First action | Likely owner |
|---|---|---|
| MQL→SQL drops sharply | Check source mix and scoring rule changes | Marketing + RevOps |
| Pipeline coverage falls below 3x | Increase top-of-funnel activity or extend the window | Sales + Marketing |
| Forecast accuracy slips below 90% | Review commit criteria and close-date hygiene | RevOps + Finance |
| Win rate drops quarter over quarter | Audit competitive losses and pricing objections | Sales leadership |
| NRR falls below | Segment churn by cohort and account size | Customer Success |
| CAC payback extends past target | Review channel mix and rep productivity | Finance + Marketing |
This mapping mirrors how the strongest RevOps KPI frameworks treat metric movement: as a trigger for a specific investigation, not a general alarm. A forecast accuracy dip, for instance, almost always traces back to sloppy close-date entry before it traces back to actual market softness. Rather than chasing generic industry benchmarks, set your guardrails from your own trailing four-quarter trend. A company with historically volatile enterprise deals should not panic at the same coverage ratio that would alarm a pure product-led motion.
Best Practices and Pitfalls That Sink RevOps Programs
The teams that get this right share a few habits. Limit the executive dashboard to 8 to 12 metrics, tie every single one to a decision someone will actually make, and enforce written definitions so “pipeline coverage” means the same thing in every meeting.
- Give every metric one named owner, not a team.
- Review the working dashboard weekly; skip a week and drift creeps in fast.
- Segment win rate and cycle length by deal size before comparing them across quarters.
- Retire any metric nobody has acted on in 90 days.
- Separate activity metrics (calls made, emails sent) from outcome metrics; the first measures effort, the second measures results.
- Audit for stale-opportunity inflation quarterly, since deals sitting open past 120 days distort both pipeline coverage and win rate.
Pro Tip: Break pipeline velocity into its four inputs, opportunity count, win rate, deal size, and cycle length, and track them individually. The composite score can stay flat while one input masks a problem in another.
Pro Tip: Treat activity-only reporting as a warning sign. A team hitting call quotas while MQL→SQL keeps falling is optimizing for the wrong thing.
Building Metric Governance That Scales
Metrics stay trustworthy only when someone governs the definitions, not just the dashboards. Build a canonical metric dictionary that lists each formula, owner, and source field, and keep a change log every time a definition shifts. Require sign-off from RevOps and Finance before anyone edits a formula that feeds the board deck.

Run a monthly data quality audit covering four things: required-field completeness by object type, duplicate contact and account rate, stale-opportunity rate (deals open past 120 days with no activity), and close-date hygiene (dates in the past that never got updated).
Split ownership three ways. RevOps owns metric definitions. Sales, marketing, and CS ops own data extraction from their respective systems. Finance and department leadership own interpretation and the decisions that follow. This separation, paired with disciplined forecast governance, keeps one team’s spreadsheet error from becoming the whole company’s bad quarter.
What a Working Dashboard and Executive Pack Should Look Like
A weekly working dashboard fits on one screen. Put pipeline coverage and velocity at the top, since they change fastest and demand the quickest reaction. Below that: MQL→SQL rate, lead response time, and sales cycle length, each segmented by team or region.
The executive pack is one page, reviewed monthly. NRR and CAC payback sit at the top because they tell the board whether growth is durable and whether spend is paying back. Forecast accuracy and ARR growth follow.
- Show trend direction (arrow or sparkline), not just the current number.
- Segment every metric by at least one dimension: team, region, or deal size.
- Set alert thresholds based on your own trailing trend, not an industry average.
- Color-code only the metrics tied to an active decision this cycle.
Your 30/60/90 Day Checklist for Rolling This Out
You don’t need a perfect system on day one. You need a sequence.
- Days 1 to 30: Canonicalize metric definitions and formulas, assign one owner per metric, and document source systems.
- Days 31 to 60: Build the working and executive dashboards, wire up source-field SLAs, and run the first weekly review.
- Days 61 to 90: Hold the first formal governance review, audit data quality, and iterate on any definition that caused confusion.
Checklist to keep handy:
- Written definition and formula for each of the 18 core metrics
- Named owner for every metric, not a shared inbox
- Source system and refresh cadence documented per metric
- Working dashboard live and reviewed weekly
- Executive pack built and capped at 12 metrics
- First data quality audit scheduled
Founders running this checklist alongside a financial planning framework tend to catch forecast drift months before it shows up in a board deck.
What Experienced RevOps Leaders Actually Prioritize
Ask a dozen RevOps leaders which metrics matter most and forecast accuracy, pipeline coverage, and NRR come up almost every time. Not because they’re trendy but because they’re the three numbers that determine whether a board conversation goes well.
Experienced leaders accept trade-offs the rest of us resist: a smaller executive dashboard, more metrics buried in the weekly working view, and a willingness to say “we don’t track that yet” rather than report a number nobody can defend. Early-stage teams lean on conversion and demand quality. Later-stage teams shift almost entirely toward forecast reliability and retention, because by then, growth is compounding or it isn’t, and the number that tells you which is NRR.
How Aidventure Helps You Turn RevOps Metrics Into Decisions
Building the table above is the easy part. Getting your CRM fields clean enough, your close dates accurate enough, and your teams aligned enough to trust the numbers is where most SaaS startups stall. Aidventure works exclusively with SaaS companies, which means the fractional CFO on your account already knows the difference between GRR and NRR without a training session.
A typical engagement starts with a SaaS KPI audit that maps your current metric definitions against the canonical set, flags where your CRM fields don’t support the formulas you’re trying to report, and hands you a 30/60/90 plan with named owners. From there, Aidventure’s fractional CFO services take over forecast governance, CAC payback tracking, and the monthly executive pack, so your leadership team walks into board meetings with numbers that hold up under questioning. Clients typically see cleaner forecasts and faster CAC payback within two quarters of standardizing definitions. If your dashboards currently disagree with each other, that audit is the next step to take.
Sources
- Revenue Operations Metrics: Guide to Measuring Performance – Fullcast
- The RevOps Metrics Framework: What to Track and Why
- The 25 RevOps KPIs That Matter in 2026 (And Why)