Financial forecasting gives businesses a forward-looking map of revenue, cash, and capital needs that drives strategic decisions, risk management, and investor communication. Rather than predicting the future with precision, forecasting creates a structured framework for tracking the drivers that actually move your business: sales volume, conversion rates, gross margin, and burn rate. U.S. Bank research finds that 71% of small business owners rank the economic environment as a top-five stressor, and a well-built forecast is the primary tool for converting that anxiety into a plan. Gartner predicts 90% of finance functions will deploy AI-enabled technology solutions by 2026, signaling that forecasting is moving from a quarterly ritual to a continuous, real-time discipline.
The immediate roles financial forecasting plays in any business:
- Strategic planning: Aligns resource allocation, hiring, and product investment with projected revenue and margin trajectories.
- Cash management and treasury: Surfaces cash gaps weeks or months before they become crises, even when the P&L looks healthy.
- Capital allocation and investor reporting: Supports funding conversations, board presentations, and capital project decisions with credible, scenario-tested numbers.
Table of Contents
- What financial forecasting actually does for your business
- The four building blocks every forecast needs
- Which forecasting methods fit your situation?
- A practical 7-step forecasting process you can follow
- How businesses use forecasts in practice
- Key metrics and KPIs your forecast must include
- Tools and systems: when to upgrade beyond spreadsheets
- Common mistakes to avoid and best practices that hold up
- How Aidventure approaches forecasting for SaaS startups
- Key Takeaways
- Why most founders get forecasting backwards
- Aidventure builds the forecasts SaaS founders actually use
- Useful sources and further reading
What financial forecasting actually does for your business
Financial forecasting predicts future financial performance by combining historical data, market trends, and explicit assumptions about your business model. The distinction between a forecast and a budget matters: a budget is a spending plan you commit to, while a forecast is a living estimate of what will actually happen given current conditions. Forecasting must precede budgeting; organizations that reverse the order risk building rigid budgets that don’t reflect cash realities, as NetSuite’s forecasting fundamentals make clear.
The benefits show up as measurable outcomes. Better capital allocation means you deploy cash toward the highest-return activities rather than spreading it thin. Reduced risk means you spot a revenue shortfall in month two of a quarter rather than month three. Improved fundraising odds come from walking into a VC meeting with a model that shows you understand your unit economics, not just your revenue line.
Forecasts serve multiple audiences inside and outside the business. Founders use them to make hiring and product decisions. FP&A and treasury teams use them to manage liquidity and covenant compliance. Investors and lenders use them to assess repayment risk and growth credibility. For strategic financial planning, the forecast is the connective tissue between your vision and your operating decisions.
The four building blocks every forecast needs
The four foundational pillars are sales forecasting, income (P&L) forecasting, cash flow forecasting, and balance-sheet projection. Each feeds the next, and skipping one creates blind spots that compound over time.
- Sales forecasting projects unit volume, average selling price, and revenue by product line or customer cohort. It is the input every other pillar depends on.
- Income (P&L) forecasting applies cost of goods sold and operating expenses to the sales forecast to project gross margin and net income. This is where founders typically start, and where they often stop.
- Cash flow forecasting translates P&L projections into actual cash timing, accounting for accounts receivable collection periods, inventory purchases, payroll cycles, and deferred revenue. A SaaS company can show a profitable P&L while burning cash if annual contracts are recognized monthly but paid upfront.
- Balance-sheet projection closes the loop by forecasting assets, liabilities, and equity at a future date, which is critical for lenders evaluating covenant ratios and investors modeling exit multiples.
The interdependency is where most forecasting errors hide. A 15% increase in sales might look like a profit win on the P&L, but if that growth requires 60-day payment terms with enterprise customers, cash flow tightens for two months before the revenue lands. A company projecting $500,000 in monthly revenue with a 45-day DSO is actually collecting roughly $750,000 in receivables before seeing that cash, a gap that can force a credit line draw even in a growth quarter.
Pro Tip: Reconcile your cash flow forecast to your P&L monthly by building a simple bridge: start with net income, add back non-cash items like depreciation, then adjust for changes in accounts receivable, accounts payable, and deferred revenue. If the two statements diverge by more than 10%, your assumptions are inconsistent and your model will mislead you.
The U.S. Small Business Administration frames variance analysis as the primary value of forecasting: comparing plan to actual surfaces the underlying drivers, not just the dollar gap. Tracking sales in units and average price per unit, rather than revenue alone, gives you the levers to manage.
Which forecasting methods fit your situation?
HBS Online identifies seven common forecasting methods, spanning quantitative approaches that rely on historical data and qualitative approaches that rely on judgment. Choosing the right method depends on data availability, time horizon, and the stakes of the decision.
| Method | Data needed | Best for | Limitation |
|---|---|---|---|
| Percent-of-sales | Historical revenue and cost ratios | Early-stage startups with limited history | Assumes cost structure scales linearly |
| Moving average | 6–24 months of actuals | Stable, recurring revenue businesses | Lags trend changes |
| Exponential smoothing | Recent actuals with a smoothing factor | Businesses with seasonal or cyclical patterns | Requires tuning the smoothing parameter |
| Regression / multi-variable | Multiple historical data series | Established firms with identifiable drivers | Requires statistical literacy and clean data |
| Pro forma statements | Comparable company benchmarks | Pre-revenue startups and fundraising models | Heavily assumption-dependent |
| Delphi method | Expert panel consensus | New markets or product categories with no history | Time-intensive; consensus can mask dissent |
| Market research / founder assumptions | Customer surveys, TAM data | Seed-stage companies entering new verticals | Subjective; needs regular recalibration |
A worked example for exponential smoothing: if your last three months of MRR were $80,000, $85,000, and $90,000, and you apply a smoothing factor of 0.3, the forecast for month four is (0.3 × $90,000) + (0.7 × $85,000) = $27,000 + $59,500 = $86,500. The method weights recent data more heavily than older data without letting a single outlier month dominate the projection.
For founders building their first model, financial modeling for entrepreneurs typically starts with percent-of-sales because it requires only a revenue assumption and a set of historical cost ratios. As the business matures and data accumulates, regression models and rolling averages add precision. Qualitative methods like the Delphi approach remain valuable when entering a new market where no comparable data exists.
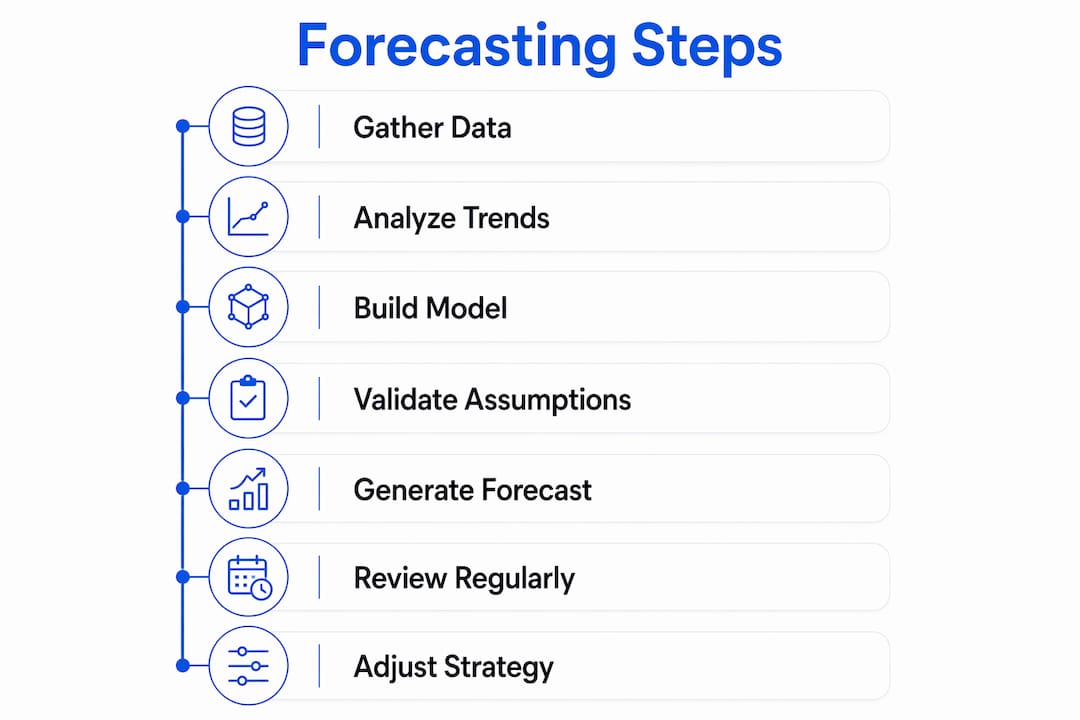
A practical 7-step forecasting process you can follow
A repeatable process matters more than a perfect model. The following workflow applies whether you are building your first forecast or refreshing a quarterly rolling model. Rolling forecasts and multi-scenario modeling convert forecasting from a reporting task into an active decision system.
Readiness checklist before you start: 12–24 months of actuals (P&L, cash flow, balance sheet), a defined owner for each assumption category, access to your CRM pipeline data, and a chosen modeling tool (Excel, Google Sheets, or an FP&A platform).
-
Collect and clean historical data (initial setup: 3–5 days; ongoing: 1–2 hours per month). Pull actuals from your accounting system. Identify and remove one-time items that would distort trend lines. Segment revenue by product, channel, or customer cohort.
-
Choose your time horizon and method (initial: 1 day; ongoing: review quarterly). A 12-month rolling forecast suits most operating decisions. An 18-month horizon captures hiring and capital needs beyond the current fiscal year. Match the method to your data depth using the table in the previous section.
-
Set and document your assumptions (initial: 2–3 days; ongoing: monthly review). Every assumption should be explicit, named, and owned by a specific person. Revenue growth rate, gross margin, headcount additions, and DSO are the four most consequential. Document the rationale, not just the number.
-
Build the model (initial: 3–7 days; ongoing: 2–4 hours per month). Start with the sales forecast, then cascade to P&L, cash flow, and balance sheet. Use a single input sheet for all assumptions so changes propagate automatically. Avoid hardcoded numbers buried in formulas.
-
Validate with stakeholders (initial: 1–2 days; ongoing: monthly). Share the model with department heads who own the cost lines. A sales leader who disagrees with the pipeline conversion assumption will tell you in a review meeting rather than after the quarter closes.
-
Run scenarios (initial: 1 day; ongoing: quarterly). Build at minimum a base case, a downside (20–30% revenue miss), and an upside. For scenario planning in finance, the downside scenario is the one that drives capital and hiring decisions, not the base.
-
Monitor, compare, and update (ongoing: monthly). The SBA’s guidance on financial management is direct: compare plan to actual every month, identify the variance drivers at the unit level (volume vs. price, conversion rate vs. traffic), and adjust forward assumptions. The forecast that never gets updated is a document, not a decision tool.
How businesses use forecasts in practice
Forecasts change decisions. The following scenarios show where the financial forecasting benefits show up in real operating situations.
Startup fundraising. A SaaS founder approaching Series A investors needs more than a revenue chart. Investors want to see ARR growth by cohort, net revenue retention, CAC payback period, and a 24-month cash runway model under base and downside assumptions. The cash flow forecast and balance-sheet projection are the documents that answer the question “how long does this last if growth is 30% slower than planned?” Forecasts that support investor communications with credible scenario modeling consistently reduce the time from first meeting to term sheet.

Hiring and capacity planning. A 20-person software company projecting 40% revenue growth needs to decide whether to hire three engineers in Q1 or Q3. The income forecast shows the margin impact; the cash flow forecast shows whether the payroll can be funded from operations or requires a credit line draw. Without both, the hiring decision is a guess.

Pricing changes. When a B2B SaaS company tests a 15% price increase on new contracts, the sales forecast needs to model two scenarios: full volume retention and a 10–15% churn on price-sensitive accounts. The P&L impact looks positive in both cases, but the cash flow impact differs materially if churned accounts had prepaid annual contracts.
Inventory and cash management. A physical-product company with 90-day supplier lead times uses its sales forecast to set purchase orders three months in advance. An overoptimistic sales forecast ties up cash in inventory; an underoptimistic one creates stockouts. The balance-sheet projection tracks inventory as an asset and flags when it exceeds a healthy ratio of monthly revenue.
Crisis response. When revenue drops suddenly, the cash flow forecast becomes the primary management tool. It answers how many months of runway remain at current burn, which expense lines can be cut without damaging revenue-generating capacity, and at what revenue level the business returns to cash-flow breakeven. For bootstrapped founders, this kind of cash visibility is the difference between a controlled pivot and a forced shutdown.
Key metrics and KPIs your forecast must include
The metrics you track in a forecast determine the decisions you can make from it. For SaaS businesses, the shortlist below covers the core drivers; for non-SaaS companies, substitute product-level gross margin and inventory turnover where ARR and churn appear.
- Annual Recurring Revenue (ARR) / Monthly Recurring Revenue (MRR): The revenue base for subscription businesses. Forecast by cohort to separate new ARR, expansion ARR, and churned ARR.
- Gross margin: Revenue minus cost of goods sold, expressed as a percentage. A declining gross margin in the forecast signals pricing pressure or rising delivery costs before they hit the P&L.
- Burn rate: Total monthly cash outflow minus cash inflow. For pre-profitability companies, this is the single most-watched number.
- Runway: Cash on hand divided by monthly net burn. Formula: Runway (months) = Cash balance ÷ Monthly net burn. A 12-month runway is a common minimum threshold for fundraising conversations.
- Customer Acquisition Cost (CAC): Total sales and marketing spend divided by new customers acquired in the period. Formula: CAC = Sales & marketing spend ÷ New customers.
- Customer Lifetime Value (LTV): Average revenue per account multiplied by gross margin percentage, divided by monthly churn rate. Formula: LTV = (ARPA × Gross margin %) ÷ Monthly churn rate.
- Churn rate: The percentage of customers or revenue lost in a period. Even a 2% monthly churn compounds to roughly 22% annual revenue loss, which a static annual forecast often obscures.
- Operating cash flow: Net income adjusted for non-cash items and working capital changes. This is the number that tells you whether the business generates cash from operations or consumes it.
For tracking business financial KPIs, the principle is granularity matched to decision stakes. A seed-stage startup needs burn rate and runway updated weekly. A Series B company needs ARR by cohort, CAC payback, and gross margin by product line updated monthly. An established firm with stable revenue can operate on quarterly KPI reviews for most metrics.
Tools and systems: when to upgrade beyond spreadsheets
Spreadsheets remain the right starting point for most early-stage companies. They are free, flexible, and fast to build. The decision to move to a dedicated FP&A platform or AI-assisted tool comes down to three factors: data volume, scenario complexity, and collaboration requirements.
When to stay in spreadsheets: fewer than three revenue streams, one or two scenario variants, a single finance owner, and a model that updates in under two hours per month.
When to move to a platform: multiple departments contributing assumptions, more than five active scenarios, audit trail requirements for investors or lenders, or a model that takes more than a day to refresh.
AI adoption in finance is accelerating fast. Gartner predicts 90% of finance functions will deploy AI-enabled technology solutions by 2026, making AI-assisted forecasting a near-term reality for most FP&A teams, not a distant aspiration.
Finance teams that deploy AI agents have reported measurable improvements in forecasting accuracy and speed, particularly in automating data ingestion, flagging assumption outliers, and generating variance commentary. The practical benefit for small teams is time: hours spent on data cleanup shift to hours spent on interpretation and decision support.
| Metric / trend | Finding | Source |
|---|---|---|
| AI adoption in finance | 90% of finance functions predicted to deploy AI-enabled tools by 2026 | Gartner |
| Small business economic stress | 71% of small business owners rank economic environment as a top-five stressor | U.S. Bank |
| Forecast modernization | Leading FP&A practice has shifted to continuous rolling forecasts with scenario modeling | DataRails |
For implementation, small teams adopting a cloud FP&A platform typically spend two to four weeks on data integration and model migration before the tool runs independently. AI-assist features within tools like integrated FP&A platforms reduce monthly refresh time once the model is stable. The data solutions that support automated forecasting and KPI tracking are increasingly accessible to companies well below the enterprise threshold.
Common mistakes to avoid and best practices that hold up
Most forecasting failures trace back to process problems, not math problems. The common forecasting mistakes that derail even experienced teams follow predictable patterns.
Don’t:
- Treat the forecast as a one-time annual exercise. A forecast that isn’t updated monthly is a historical document by March.
- Ignore the cash vs. P&L gap. Profitable companies run out of cash. Build both statements and reconcile them.
- Use stale assumptions. A pricing assumption from 18 months ago that hasn’t been revisited will compound error across every downstream projection.
- Silo data by department. When sales, finance, and operations each maintain separate spreadsheets, the consolidated model reflects politics, not reality.
- Forecast only the base case. A single-scenario model gives false confidence and leaves leadership unprepared for the downside.
Do:
- Reforecast monthly, or at minimum quarterly, using a rolling forecast approach that always extends 12 months forward.
- Assign explicit ownership for each assumption category: the VP of Sales owns pipeline conversion, the Head of Engineering owns headcount, the CFO or fractional CFO owns the capital structure.
- Run a plan-vs-actual review every month. The SBA’s guidance is clear: you don’t just look at the numbers, you look at the business behind the numbers.
- Document assumption rationale, not just the number. When an assumption proves wrong, you need to know why it was set that way to correct it intelligently.
- Match forecast depth to decision stakes. A hiring decision for one role doesn’t need a full three-statement model; a $2M capital raise does.
Pro Tip: When sharing a forecast with investors or your board, lead with the key assumption that most determines the outcome, not the revenue number. A one-paragraph framing works well: “Our base case assumes 8% monthly new ARR growth driven by two enterprise deals closing in Q2. The downside assumes one deal slips to Q3, reducing Q2 ARR by $X and extending our runway from 14 to 11 months. We are managing to the downside by holding headcount flat until Q2 close.” This framing shows you understand your own model and have thought through the risk.
How Aidventure approaches forecasting for SaaS startups
A mid-stage SaaS company approached Aidventure with a common problem: the founders had a revenue model in a spreadsheet, but it didn’t connect to cash flow, the board was asking for scenario analysis they couldn’t produce, and the monthly close took 12 days, leaving no time for forward-looking work. The finance function was stuck in historical scorekeeping.
Aidventure’s approach began with a SaaS KPI audit to establish which metrics were being tracked, which were missing, and which were being calculated inconsistently across departments. From there, the team rebuilt the three-statement model with a single assumption input sheet, integrated it with the company’s accounting system to automate actuals ingestion, and established a monthly reforecasting cadence with a defined owner for each assumption category.
30 days. The immediate priority is data integrity: reconcile historical actuals, identify gaps in the chart of accounts, and document the current state of revenue recognition. The owner is the Aidventure finance lead working alongside the founder or CFO. The expected outcome is a clean baseline that the forecast can be built on without inheriting prior errors.
60 days. The three-statement model is built, connected to live accounting data, and stress-tested against the last six months of actuals. Scenario variants (base, downside, upside) are documented with explicit assumption rationale. Department heads review and sign off on their cost assumptions. The expected outcome is a model the team trusts and can update in under two hours per month.
90 days. The monthly reforecasting cadence is running. Plan-vs-actual variance reports are produced within five business days of month-end close. The board or investor deck includes a one-page forecast summary with scenario commentary. The expected outcome is a finance function that advises on decisions rather than reporting on them after the fact.
Pro Tip: For pre-revenue or early-stage startups, the most valuable forecasting work is often the simplest: a 12-month cash flow model with weekly granularity for the first 90 days, built from actual committed expenses and conservative revenue assumptions. Founders who start with this level of detail rarely get surprised by a cash crisis. For guidance on accounting for pre-revenue startups, the fundamentals of clean books and documented assumptions apply from day one.
Key Takeaways
Financial forecasting is the primary tool that connects a business’s strategy to its operating decisions, and the four-pillar model (sales, P&L, cash flow, balance sheet) is the minimum viable structure for any company making capital or hiring decisions.
| Point | Details |
|---|---|
| Four pillars are non-negotiable | Sales, income, cash flow, and balance-sheet forecasts must connect; a P&L alone will hide cash gaps. |
| Rolling forecasts beat annual plans | Update your forecast monthly and extend it 12 months forward so it stays decision-relevant year-round. |
| Variance analysis drives value | Comparing plan to actual at the driver level (units, price, conversion) surfaces what to manage, not just what happened. |
| Match method to data maturity | Early-stage companies start with percent-of-sales; established firms add regression and multi-variable models as data accumulates. |
| Aidventure for SaaS forecasting | Aidventure’s fractional CFO and KPI audit services build three-statement models connected to live data for SaaS startups. |
Why most founders get forecasting backwards
The conventional wisdom says forecasting is about accuracy. Build the most precise model, hit the number, and you’ve done it right. That framing is wrong, and it causes founders to either over-engineer models they never update or dismiss forecasting entirely because “the numbers are always wrong anyway.”
The actual value of a forecast is not the number. It’s the discipline of making your assumptions explicit, reviewing them against reality every month, and adjusting your operating decisions before the variance becomes a crisis. A forecast that is 20% off but gets reviewed monthly and updated with driver-level variance analysis is worth ten times more than a precise model that sits untouched in a shared drive.
What founders consistently underestimate is the governance side: who owns each assumption, how often the model gets refreshed, and whether the board sees a scenario range or a single point estimate. A single-scenario forecast presented to investors signals that the team hasn’t thought through the risk. A three-scenario model with explicit levers signals that the team understands its own business well enough to manage it under pressure.
Forecasting is not prophecy. It’s a decision framework. The cadence and ownership structure matter as much as the model itself, and that’s where most teams need to invest first.
Aidventure builds the forecasts SaaS founders actually use
Most SaaS startups don’t need a bigger spreadsheet. They need a three-statement model connected to live data, a monthly reforecasting cadence, and a finance partner who can translate the numbers into decisions. That’s what Aidventure delivers through its fractional CFO services and flexible financial planning for early-stage and scaling SaaS companies.

The engagement starts with a SaaS KPI audit to establish a clean baseline, then moves to model build, scenario testing, and an ongoing monthly cadence. Founders get board-ready forecasts, investor-facing scenario commentary, and a finance function that advises on decisions rather than reporting on them after the fact. There are no long-term contracts and no full-time CFO salary required. If you want to see what a reliable, decision-ready forecast looks like for your business, book a consultation with Aidventure and get a clear picture of where your numbers stand.
Useful sources and further reading
-
U.S. Small Business Administration — Why Bother with Financial Forecasts: The SBA’s practitioner-focused guide explains variance analysis and driver-level tracking in plain language. Useful for founders who want the management rationale for forecasting without the technical complexity.
-
NetSuite — What Is Financial Forecasting? 8 Steps to Create a Financial Forecast: Covers the four building blocks, the relationship between forecasting and budgeting, and a step-by-step process. A solid reference for the mechanics of building a three-statement model.
-
NetSuite — The Importance of Financial Forecasting: Focuses on how forecasts support capital allocation, investor communications, and funding decisions. Useful for founders preparing for fundraising conversations.
-
HBS Online — 7 Financial Forecasting Methods to Predict Business Performance: Describes seven forecasting methods with guidance on when to use quantitative vs. qualitative approaches and how pro forma statements work for pre-revenue companies.
-
DataRails — Financial Forecasting: Predict, Adapt, and Win: Covers the shift from static annual plans to rolling, scenario-aware forecasts. Strong on the FP&A modernization argument and the practical case for continuous reforecasting.
-
Precoro — Financial Forecasting: Methods, Benefits & Common Pitfalls: A practitioner-oriented overview of forecasting definitions, benefits, and common failure points. Useful for teams building their first formal forecasting process.
-
Gartner — FP&A and Finance Technology Coverage: The primary source for AI adoption statistics in finance functions, including the 90% deployment prediction for AI-enabled tools by 2026. Relevant for teams evaluating platform investments.
-
U.S. Bank — Small Business Perspective Research: Source for the finding that 71% of small business owners rank the economic environment as a top-five stressor, which grounds the case for multi-scenario forecasting and rolling models.