Net revenue retention (NRR) is defined as the percentage of recurring revenue retained from existing customers over a set period, after accounting for expansion, contraction, and churn. SaaS founders and business analysts who understand why track net revenue retention matters gain a direct window into revenue health, product-market fit, and capital efficiency. The 2025 median NRR for B2B SaaS sits at 102%, with top-quartile companies reaching 110% or above and best-in-class performers exceeding 120%. Those benchmarks tell you exactly where your business stands relative to the market, without guesswork.
Why track net revenue retention in your SaaS business
NRR reveals whether your existing customers are funding your growth or quietly draining it. A company with NRR above 100% generates more revenue from its current customer base each period than it started with. That means growth happens even without a single new logo, which fundamentally changes how you allocate budget and headcount.
The metric also shapes investor perception and valuation. Investors prioritize NRR as a predictor of long-term capital efficiency and sustainable growth, often weighting it more heavily than other SaaS metrics. A high NRR signals that your product delivers enough value for customers to spend more over time, which is the clearest proof of product-market fit available.

NRR also improves forecasting accuracy. When you know that your existing base will generate $X next quarter based on historical expansion and churn patterns, your Annual Recurring Revenue (ARR) projections become grounded in real behavior rather than assumptions. That precision matters when you are presenting to a board, negotiating a credit facility, or planning a hiring cycle.
Consider a concrete example: a company at $10M ARR with 120% NRR can reach $20M ARR in under four years without acquiring a single new customer. That kind of compounding from within the existing base is what separates capital-efficient SaaS businesses from those burning cash on constant new acquisition.
What does NRR actually reveal about revenue health?
NRR captures three forces simultaneously: expansion revenue from upsells and cross-sells, contraction from downgrades, and churn from cancellations. No other single metric combines all three. Gross Revenue Retention (GRR), by contrast, excludes expansion and caps at 100%. The median GRR sits at 84% versus a median NRR of 102%, which shows how much expansion revenue lifts the overall picture.
A business with strong NRR but weak GRR is running on a fragile foundation. Expansion revenue can mask high churn for several quarters, but eventually the leaking base catches up. Tracking both metrics together gives you the full picture: GRR tells you how well you retain customers, while NRR tells you how much they grow.
NRR also signals product-market fit more reliably than customer satisfaction scores or Net Promoter Score. Customers who expand their contracts are voting with their budgets. That behavior is harder to fake than a survey response.
How to measure net revenue retention accurately
The NRR formula is straightforward. Take the recurring revenue from a defined customer cohort at the start of a period, add expansion revenue earned during that period, subtract contraction and churn, then divide by the starting revenue. Multiply by 100 to express it as a percentage.
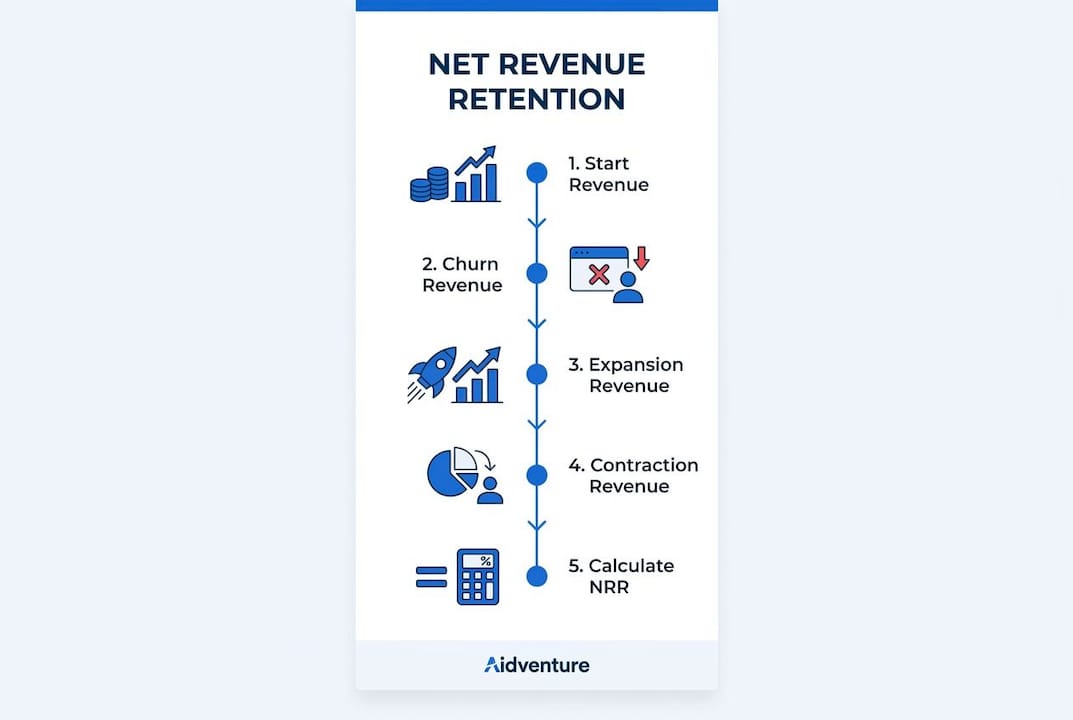
Accurate measurement depends on clean, reconciled data from three systems: your CRM, your billing platform, and your finance system. Automating the data flow between these systems reduces manual errors and keeps your NRR current. Manual reconciliation produces stale data, and stale data leads to decisions made on outdated signals.
The most common calculation errors include:
- Mixing cohorts. Including new customers in the same calculation as existing ones inflates NRR and hides true retention performance.
- Ignoring partial-period churn. Customers who cancel mid-month still represent lost revenue. Exclude them from the starting cohort or account for the partial amount.
- Conflating one-time fees with recurring revenue. Professional services, setup fees, and one-time add-ons are not recurring. Including them distorts the metric.
- Failing to segment by customer size. A handful of enterprise expansions can mask widespread SMB churn in an aggregate NRR figure.
Pro Tip: Run NRR calculations monthly by acquisition cohort, not just as a company-wide annual figure. Cohort-level analysis surfaces early warning signs and growth trends that aggregate data hides entirely.
The table below shows how NRR and GRR differ in what they measure and what they signal:
| Metric | Includes expansion | Cap | 2025 median | Primary signal |
|---|---|---|---|---|
| NRR | Yes | None | 102% | Revenue growth from existing base |
| GRR | No | 100% | 84% | Pure retention without expansion |
Benefits of tracking revenue retention for growth and investment
Tracking NRR consistently produces direct financial and strategic advantages. The most immediate is cost efficiency. Expansion revenue costs roughly 20–30% of what new customer acquisition costs. Every dollar of upsell or cross-sell revenue is dramatically cheaper than a dollar from a new logo. That cost difference compounds over time and directly improves your burn multiple.
The strategic benefits extend beyond cost:
- Investor confidence. High NRR correlates with higher valuation multiples. Investors read it as proof that the product has durable value and that the go-to-market motion is efficient.
- Proactive management. Regular NRR tracking lets you spot contraction trends before they become churn. A cohort that starts contracting in month six gives you time to intervene with a customer success motion.
- Budget allocation. When you know which customer segments expand most reliably, you can direct sales and marketing spend toward acquiring more of that profile.
- Burn rate control. A business growing primarily through expansion rather than new acquisition spends less per dollar of ARR added, which extends runway and reduces dilution.
“A SaaS company that tracks NRR by cohort and customer segment does not just measure growth. It manages growth. The difference between those two postures is the difference between reacting to churn and preventing it.”
Understanding the importance of net revenue retention as a financial KPI is what separates founders who scale with control from those who scale with anxiety.
How pricing models and segmentation affect NRR outcomes
Pricing architecture is the single largest structural driver of NRR. Usage-based pricing models produce a median NRR of 108%, while seat-based models produce a median of 98%. That 10-percentage-point gap reflects a fundamental difference in how expansion happens.
Usage-based models expand organically as customers grow. A customer who processes more transactions, sends more emails, or stores more data automatically generates more revenue without a sales conversation. Seat-based models require a deliberate upsell motion, and that motion is increasingly challenged by AI tools that consolidate work across fewer seats. SaaS marketing and financial alignment becomes especially important when a pricing model shift is under consideration, since the revenue impact flows through every financial projection.
Segmenting NRR by product line, cohort, and customer size reveals patterns that company-wide averages hide entirely. A SaaS business might show 105% aggregate NRR while its enterprise segment runs at 118% and its SMB segment runs at 91%. Without segmentation, the enterprise strength masks the SMB problem. With it, you know exactly where to focus retention resources.
Pro Tip: Segment NRR by customer acquisition cohort and review it quarterly. Cohorts acquired during a specific campaign or product version often show distinct retention patterns that reveal whether a go-to-market change actually improved long-term value.
Practical responses to segmented NRR data include redirecting customer success headcount toward high-churn SMB cohorts, accelerating product development for features that drive enterprise expansion, and adjusting pricing tiers to capture more value from high-usage customers.
Key Takeaways
NRR above 100% means existing customers fund growth, making it the most capital-efficient path to scaling ARR in SaaS.
| Point | Details |
|---|---|
| NRR benchmark context | The 2025 median B2B SaaS NRR is 102%; top-quartile companies reach 110% or above. |
| Expansion cost advantage | Growing revenue from existing customers costs 20–30% of what new acquisition costs. |
| GRR as a companion metric | Track GRR alongside NRR to detect churn masked by aggressive upselling. |
| Cohort segmentation | Segment NRR by acquisition cohort and customer size to find hidden churn and growth drivers. |
| Pricing model impact | Usage-based pricing produces a median NRR of 108% versus 98% for seat-based models. |
NRR tracking: what most founders get wrong
I have worked with enough SaaS founders to know that the most common mistake is not ignoring NRR. It is tracking it at the wrong level of granularity. A single company-wide NRR number feels reassuring until you segment it and discover that your best cohort is carrying your worst one.
The second mistake is trusting a high NRR without checking GRR. I have seen businesses with 115% NRR and 78% GRR. That combination is a warning sign, not a success story. The expansion revenue is real, but the churn underneath it is accelerating. Eventually the bucket empties faster than the upsells can fill it. A high NRR with low GRR signals a fragile business model, not a healthy one.
The operational lesson I keep returning to is automation. Every team that manually pulls NRR from spreadsheets is working with data that is already two weeks old. By the time you see the problem, the customer has already decided to leave. Connecting your CRM, billing, and finance systems so NRR updates automatically is not a luxury. It is the baseline for making decisions that are actually current.
The founders who get the most value from NRR are the ones who treat it as an operational signal, not a reporting metric. They review it monthly, segment it by cohort, and tie it directly to customer success priorities. That discipline is what turns a number into a growth lever.
— Sergio
Aidventure’s approach to NRR tracking and SaaS financial clarity
SaaS founders who want NRR to drive decisions, not just appear in board decks, need financial infrastructure that keeps the metric current and meaningful.

Aidventure provides fractional CFO services built specifically for SaaS companies at the scaling stage. The team sets up the data flows, cohort frameworks, and KPI dashboards that make NRR a live operational tool rather than a quarterly calculation. Founders also get guidance on managing finances without a full-time CFO, including how to structure revenue retention analysis alongside ARR, GRR, and burn rate. If your NRR data is currently assembled by hand, Aidventure can change that.
FAQ
What is a good NRR for a SaaS company?
The 2025 median B2B SaaS NRR is 102%. Top-quartile companies reach 110% or above, and best-in-class performers exceed 120%.
How is NRR different from GRR?
NRR includes expansion revenue and can exceed 100%, while GRR excludes expansion and caps at 100%. The 2025 median GRR is 84%, compared to 102% for NRR.
Why is revenue retention important for investors?
Investors treat NRR as a direct indicator of capital efficiency and long-term growth sustainability. High NRR correlates with stronger valuation multiples in SaaS fundraising.
How often should SaaS companies calculate NRR?
Monthly calculation by acquisition cohort is the standard best practice. Quarterly reviews at the segment level catch trends that annual figures miss entirely.
Can a high NRR hide business problems?
Yes. A high NRR driven by aggressive upselling alongside a GRR below 85% signals that underlying churn is being masked. Tracking both metrics together reveals the true health of the revenue base.